
Estimated White IQ Across the United States
IQ Map of White People in America

While data on IQ by U.S. state is available, I could not find any map showing White IQ differences by state. The closest I found was Cremieux’s post on the performance of various American ethnic groups on NAEP in 2022.
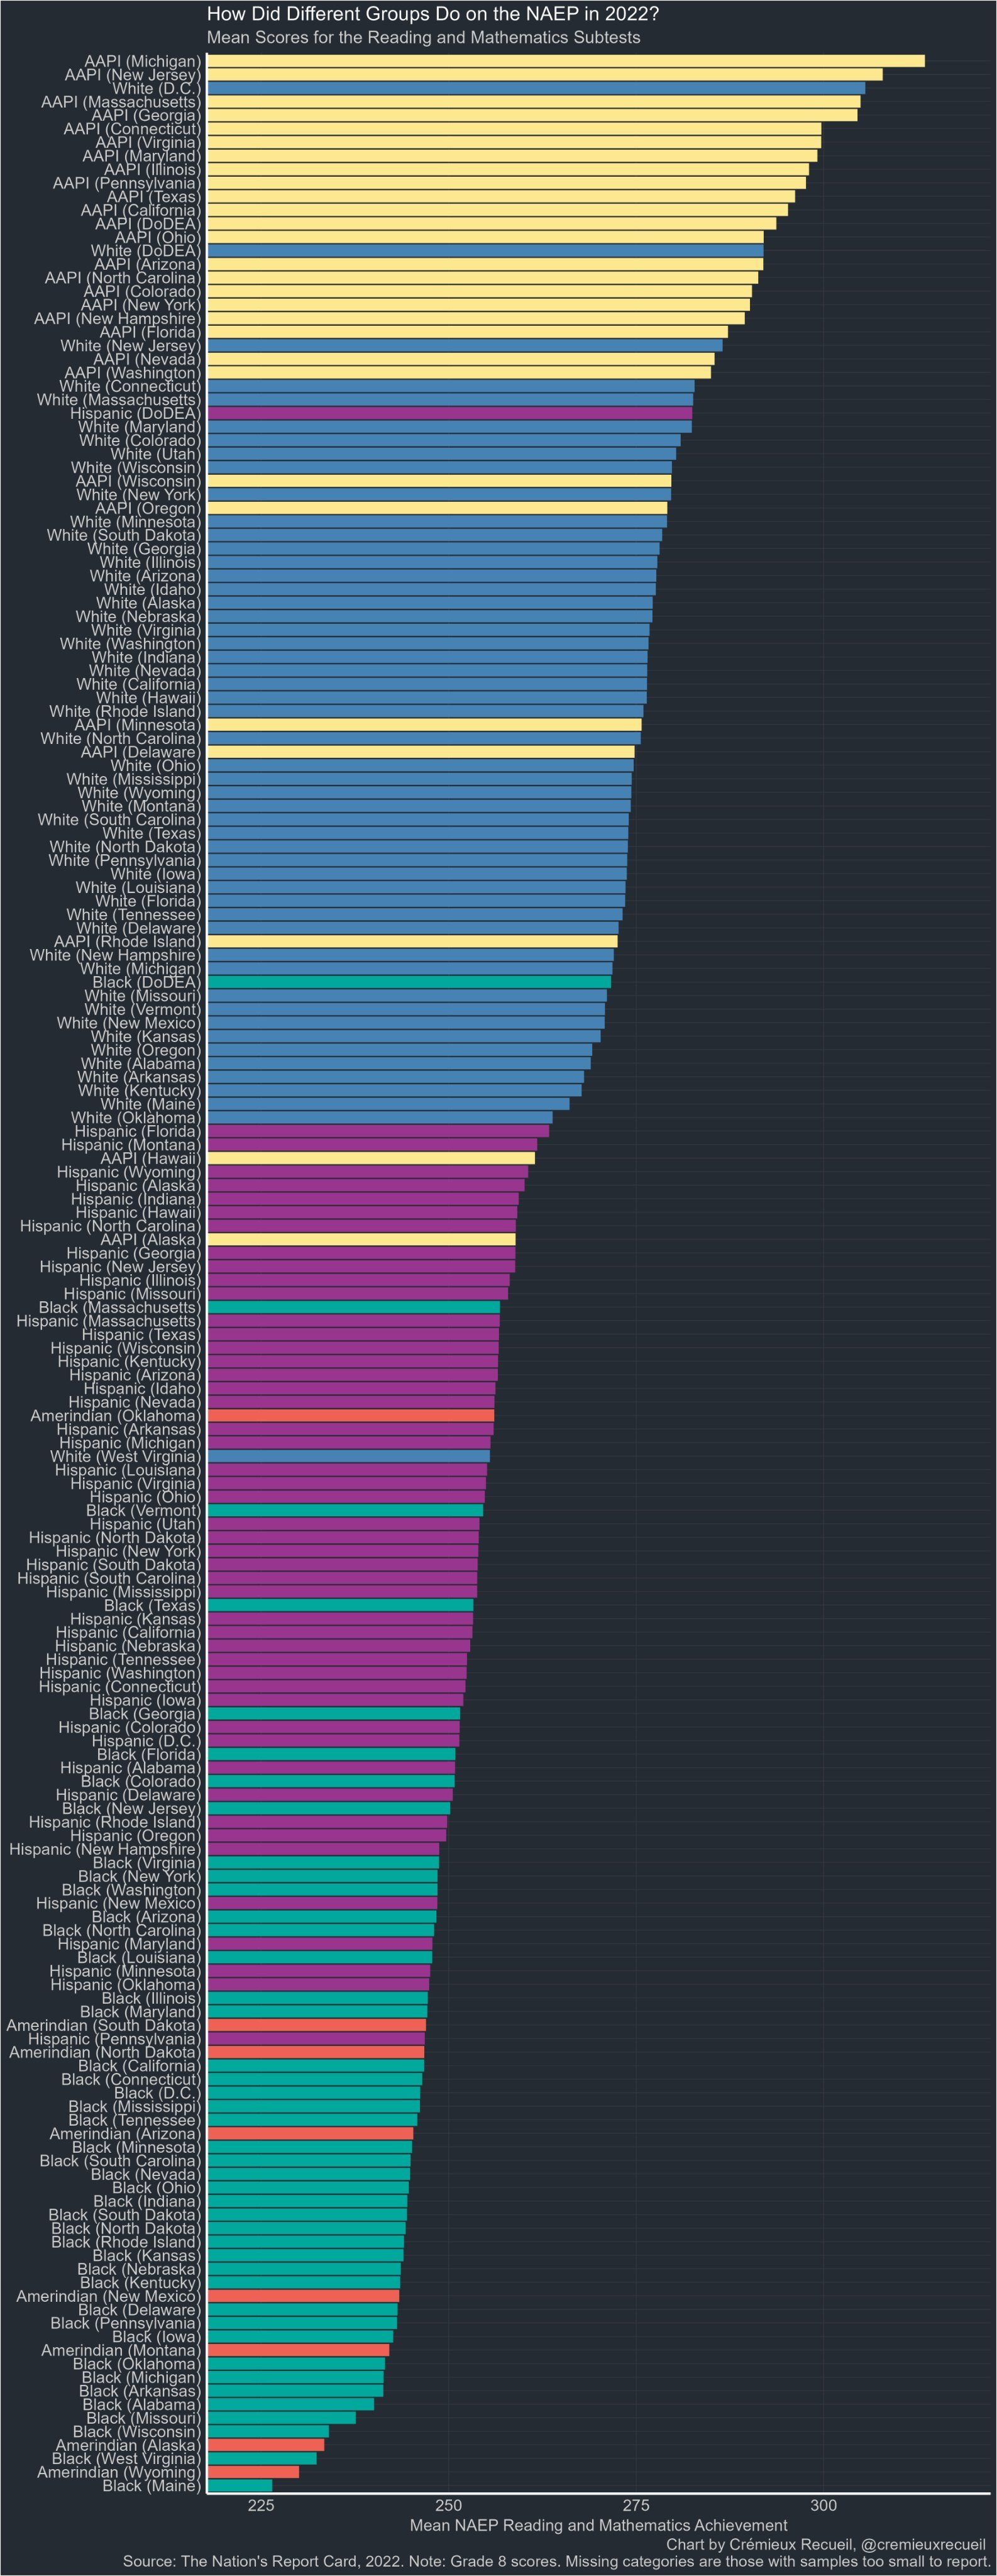
Unfortunately his screenshot is too poor to give a proper estimate and the data is lightly outdated and so I decided to look into the data myself, and thankfully my data is 2 years younger than his.
I acquired the data for 8th grader math performance in 2024 from a governmental website and then converted them into IQ.
The score means that I obtained are as follows:
District of Columbia: 304
DoDEA: 285
Massachusetts: 276
Connecticut: 275
New Jersey: 275
Hawaii: 274
Colorado: 273
Maryland: 272
Georgia: 271
Illinois: 270
California: 269
Indiana: 269
Rhode Island: 269
Arizona: 268
Louisiana: 267
Ohio: 267
Texas: 267
Washington: 267
Minnesota: 266
Pennsylvania: 266
Tennessee: 266
Utah: 266
Virginia: 266
Wisconsin: 266
Idaho: 265
Iowa: 265
New York: 265
South Dakota: 265
Mississippi: 264
Montana: 264
New Hampshire: 264
North Carolina: 264
South Carolina: 264
Florida: 263
Kentucky: 263
Nebraska: 263
New Mexico: 263
Wyoming: 263
Alaska: 262
Nevada: 262
Arkansas: 261
Missouri: 261
Oregon: 261
Alabama: 260
Delaware: 260
Kansas: 260
Michigan: 260
North Dakota: 260
Vermont: 258
Oklahoma: 257
Maine: 256
West Virginia: 248
The White American national average is: 266
On this basis, I equated a score of 266 to an IQ of 100 since that is the average White American IQ and my calculation formula is IQ = 100 + 2.66 × z where z = (score - dataset mean) / dataset SD. Here are the results:
District of Columbia: 112.5
DoDEA: 107.0
Massachusetts: 103.4
Connecticut: 103.0
New Jersey: 103.0
Hawaii: 102.6
Colorado: 102.3
Maryland: 101.9
Georgia: 101.5
Illinois: 101.1
California: 100.7
Indiana: 100.7
Rhode Island: 100.7
Arizona: 100.3
Louisiana: 99.9
Ohio: 99.9
Texas: 99.9
Washington: 99.9
Minnesota: 99.5
Pennsylvania: 99.5
Tennessee: 99.5
Utah: 99.5
Virginia: 99.5
Wisconsin: 99.5
Idaho: 99.1
Iowa: 99.1
New York: 99.1
South Dakota: 99.1
Mississippi: 98.7
Montana: 98.7
New Hampshire: 98.7
North Carolina: 98.7
South Carolina: 98.7
Florida: 98.3
Kentucky: 98.3
Nebraska: 98.3
New Mexico: 98.3
Wyoming: 98.3
Alaska: 97.9
Nevada: 97.9
Arkansas: 97.5
Missouri: 97.5
Oregon: 97.5
Alabama: 97.2
Delaware: 97.2
Kansas: 97.2
Michigan: 97.2
North Dakota: 97.2
Vermont: 96.4
Oklahoma: 96.0
Maine: 95.6
West Virginia: 92.3
Here is an IQ map of White Americans based on the earlier estimations.
And here is the IQ map of all races for comparison (not sure how accurate it is tbh).
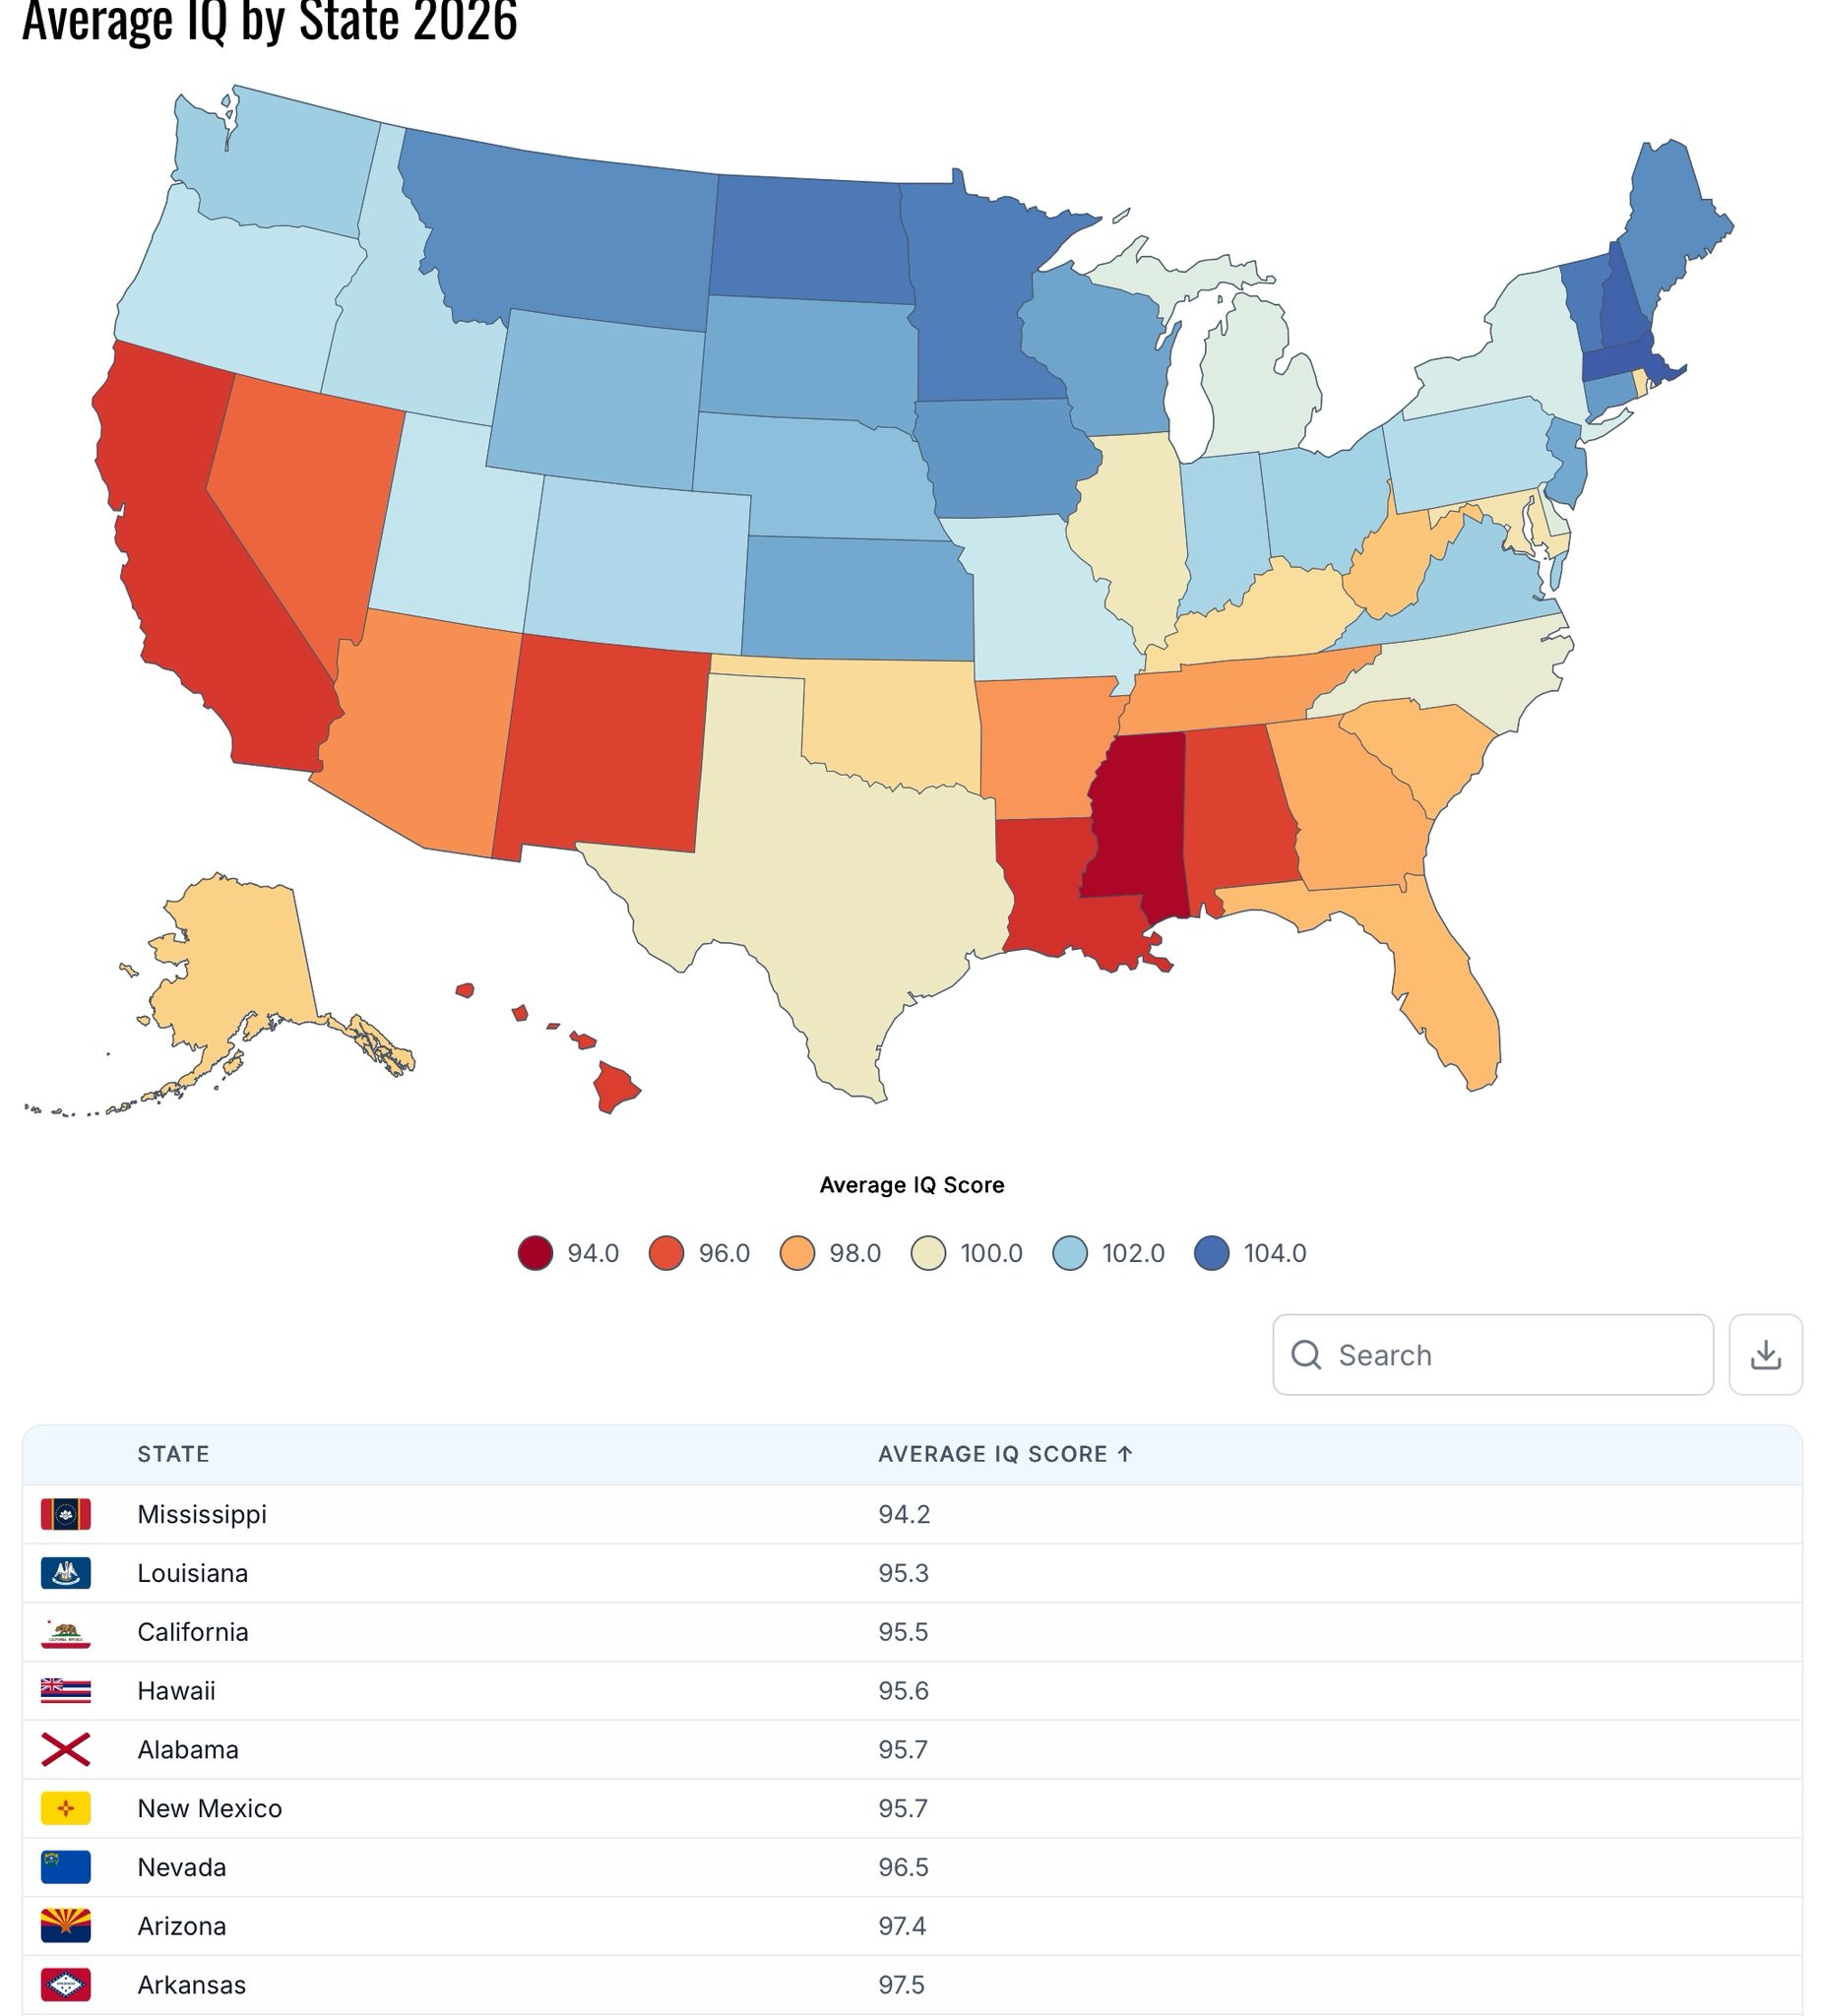
As you can see, there are several notable discrepancies. Most notably, the Northeast and West Virginia are ranked much lower on my map than they are on other maps without a coherent methodology, given that even SAT scores poorly capture what I see online.
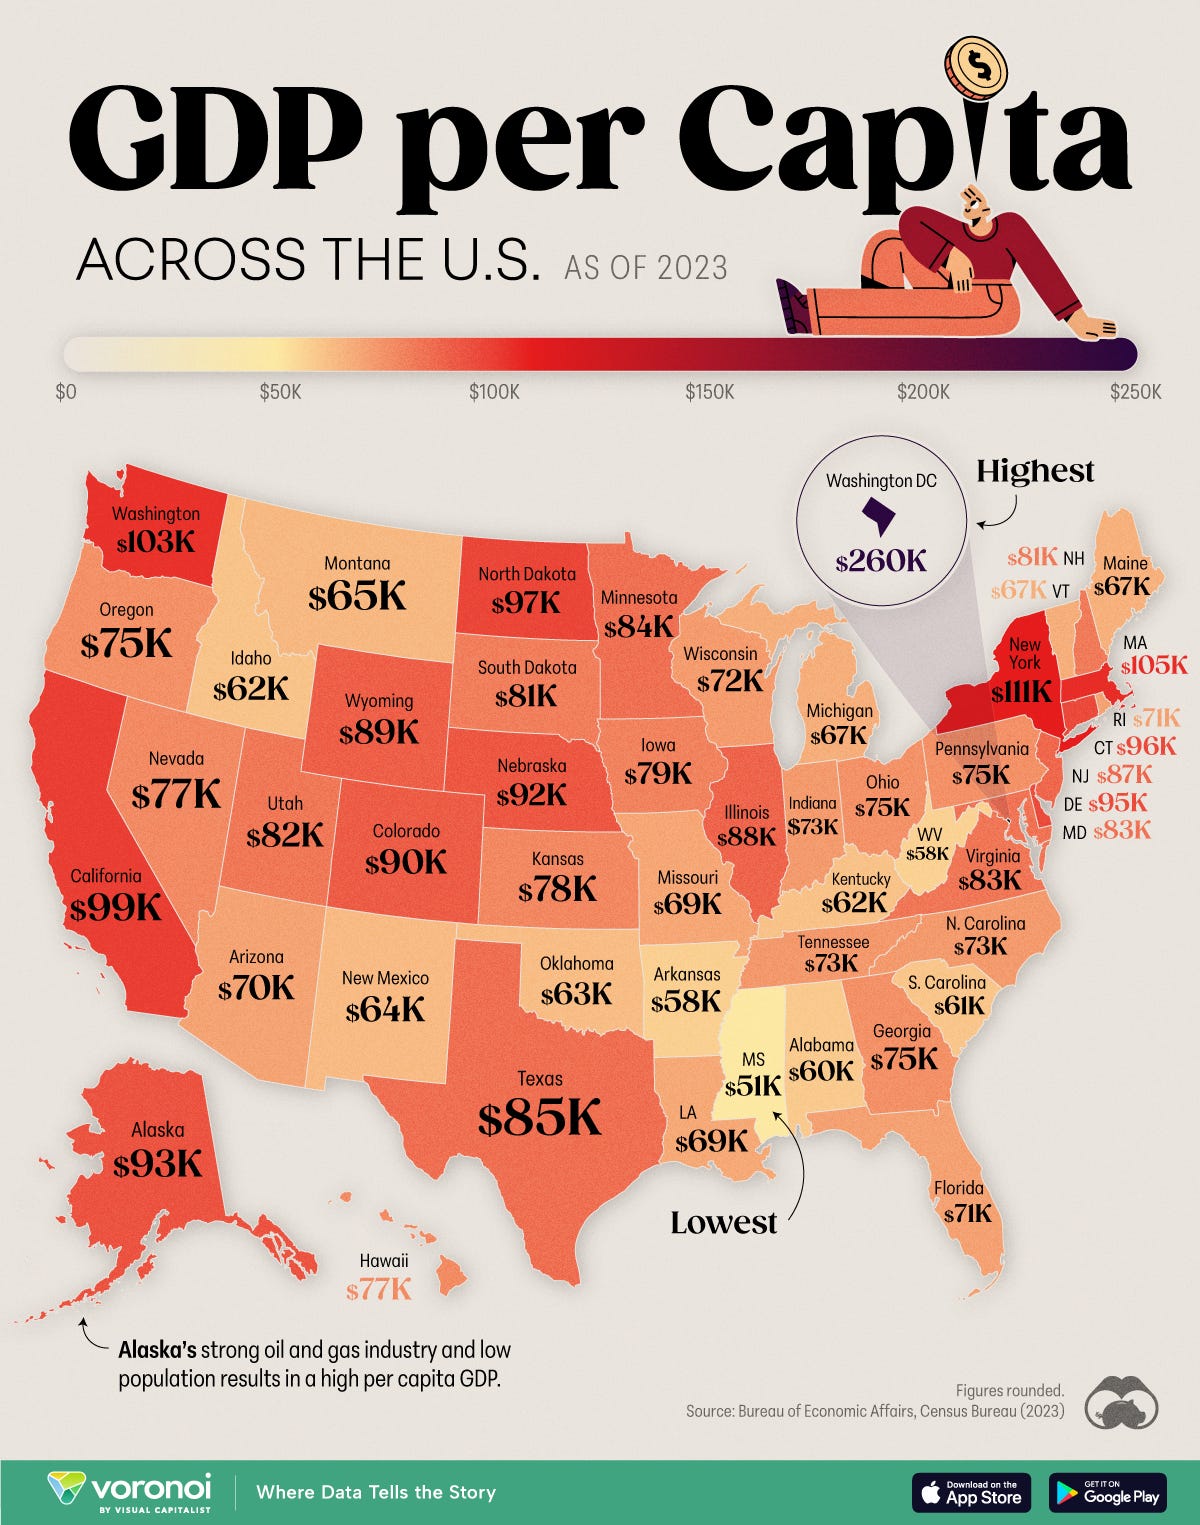
One curious finding is that my map correlates better with GDP per capita than the ones I found online. Just take a look at Maine, Vermont and West Virginia and tell me whether my map correlates with it better or whether you believe West Virginian IQ is around 98 as it is claimed online.
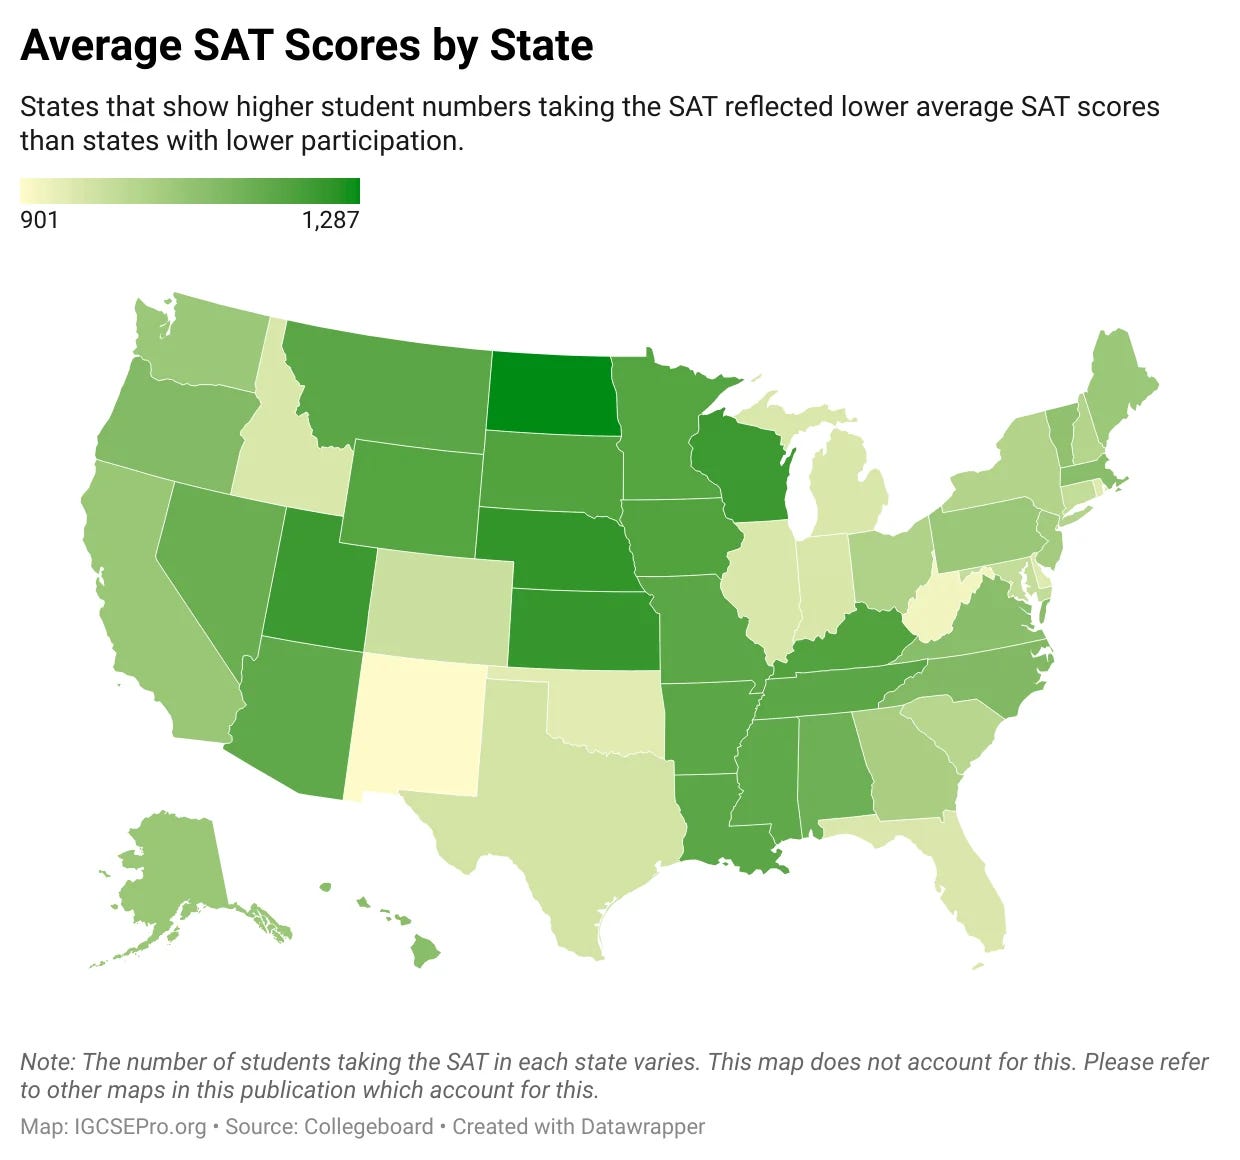
Nonetheless there is room for improvement as I looked only at the math scores, without combining it with reading scores. I also could not find a racial breakdown of SAT by race in each state either. If you want to design a better map, you know how to do it. You should at least start by averaging math and reading scores obtained from the same website.
Let me know if I should return to more data posting like I used to in the past or do you prefer my analysis of the current events.