
Who gained the most after the collapse of the USSR?
Assessing prosperity, human development, and demographic shifts by comparing relative global standing.

Attitudes towards the Soviet Union and the Socialist mode of development vary in Eastern Europe. Many people hated it and there certainly is an amount of nostalgia for these times in many places which were under the Soviet grip.
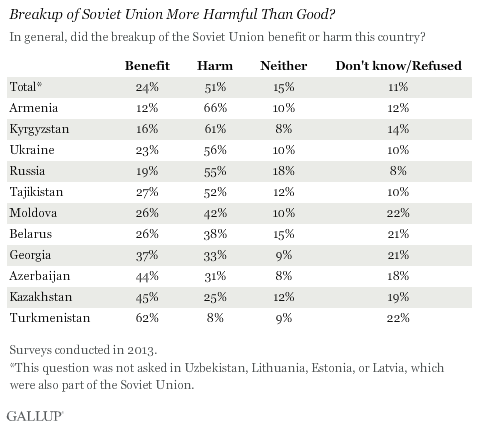
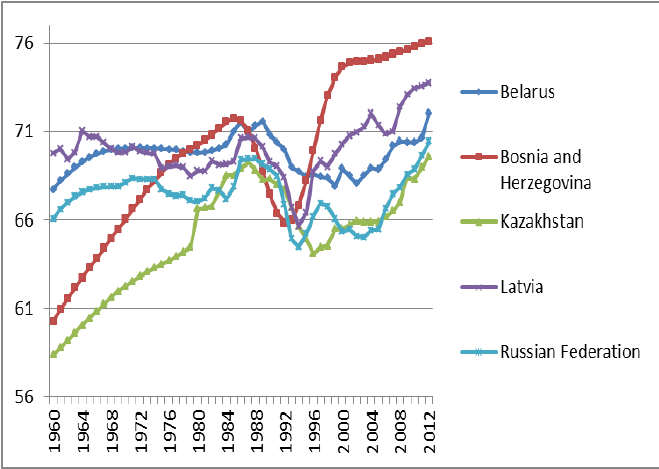
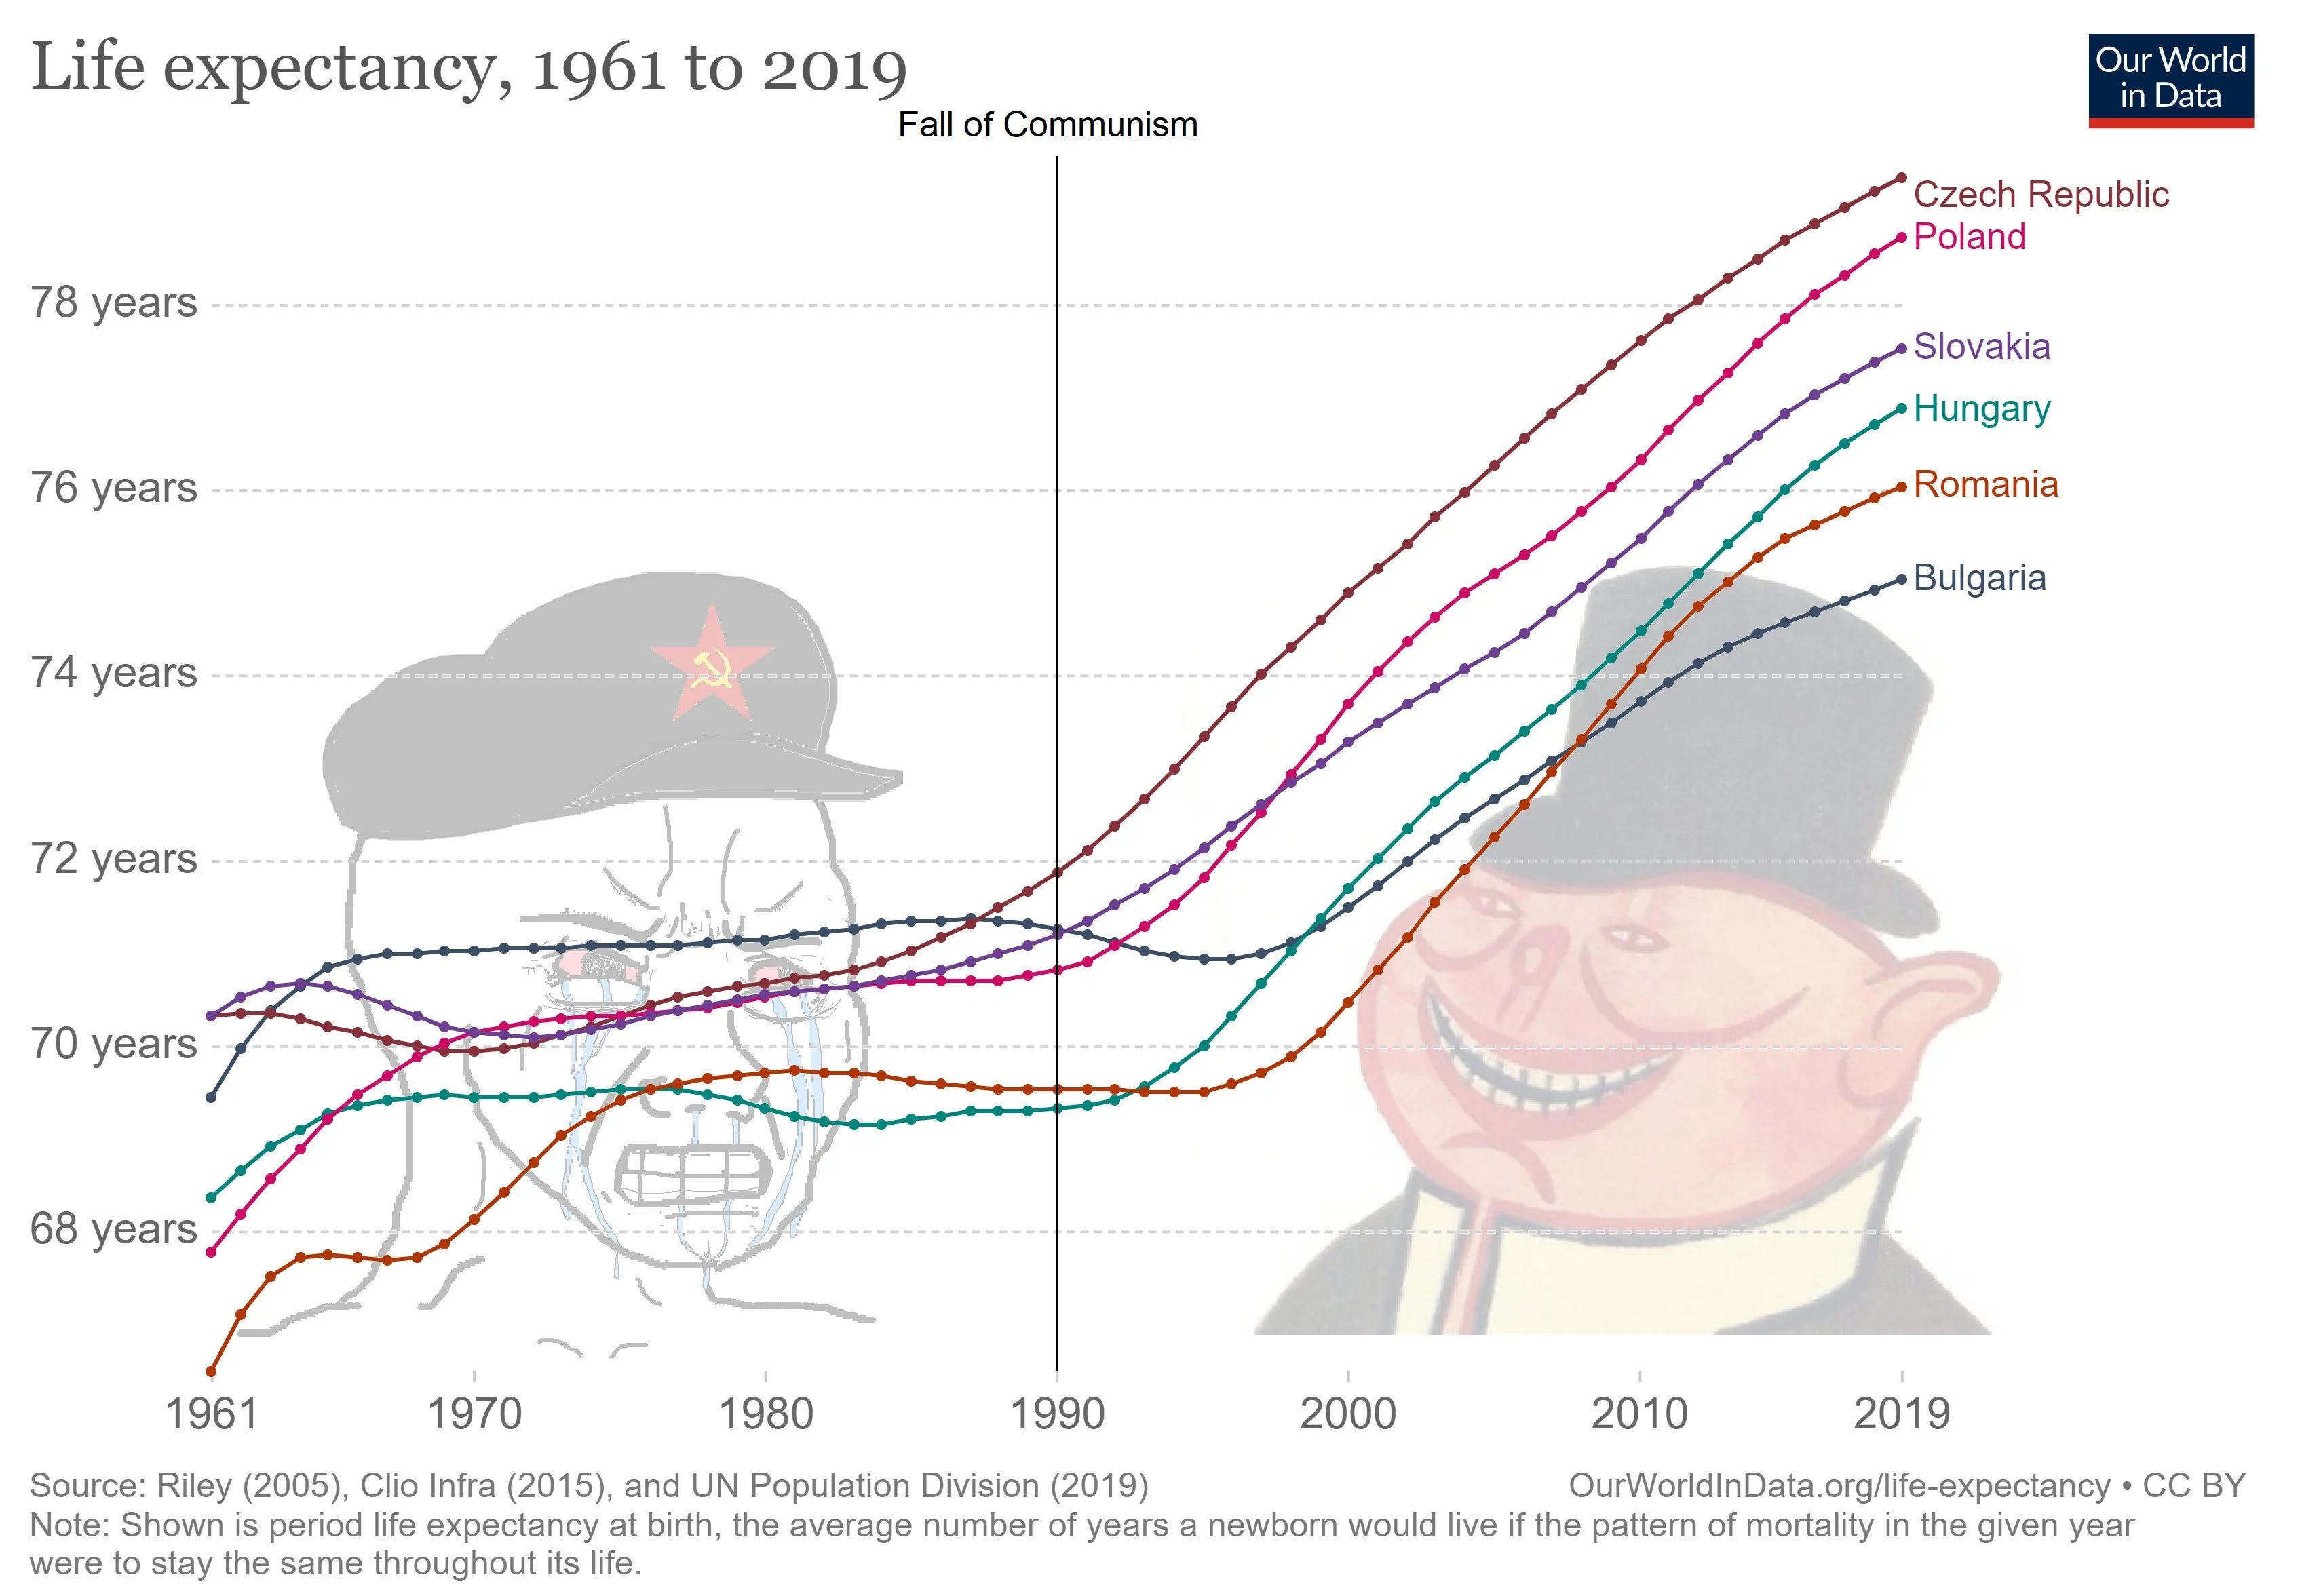
My goal in this essay is to examine whether these claims hold merit, as the economic record is clear: the collapse of the Soviet Union brought significant benefits to some, while devastating the lives of others (both within countries and between countries). Here is the average life expectancy as an example:
In this essay, I will not delve into the details of specific issues such as levels of freedoms or car ownership per capita, which have undeniably risen everywhere after the collapse of the Eastern Bloc, nor will I comment the matters of ethnic or national self-determination of the many nations formerly under Soviet rule. Instead, I will focus on what can be measured, and on areas for which ample data exists.
To do that, I have taken data on GDP per capita, adjusted it for purchasing power, HDI, total population and vital statistics like births. My goal was to compare and contrast the 1990 measurements with the latest ones for each country and see whether a country’s standing relative to the rest of the world was better during the Soviet Era or during the contemporary era.
I feel like this is a unique metric no one has yet tried because fundamentally both socialism and capitalism are simply modes of development that should be judged in accordance to which brings you better prosperity. Most people who have weighed in on this have so far ignored this approach, preferring instead to compare Soviet and post-Soviet times within one specific country, not in relation to that country to the global average.
My main thesis is that the genetic potential of people pre-determines their success in both Socialist and Capitalist settings. Just like GDR and Czechoslovakia were the richest country in the Eastern Bloc, they were also the countries to gain the most from the collapse of the Soviet Union. Likewise, Tajikistan and Albania were undeveloped in the Soviet Era and they still are underdeveloped, but sometimes there are success stories like with Romania.
Obviously, by no means does this essay settle the question, for it needs a much broader approach including salary measurements (which were difficult to calculate and standardize), EHC count, scientific output, and many other metrics that will decisively establish the answer.
In the following paragraphs, I will present three-fifths of the data I have gathered. The remainder, along with a discussion of my findings and a defense of my unique approach to this question, will be available beyond the paywall.
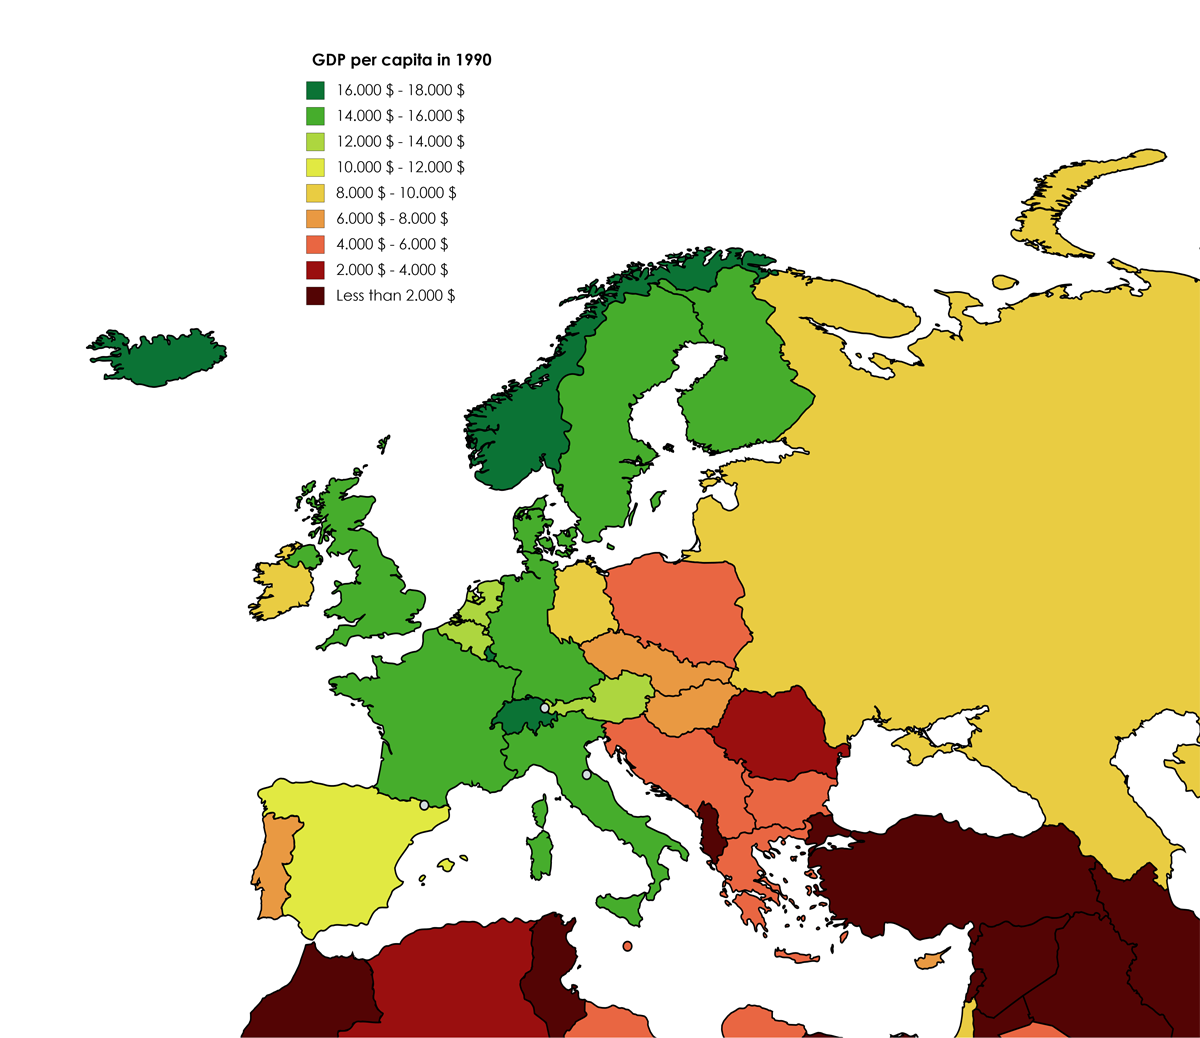
GDP per capita PPP of Soviet Republics for 1990, using World Bank data
Lithuania: 8,946
Russia: 8,027
Kazakhstan: 7,874
Ukraine: 7,590
Estonia: 7,475
Latvia: 7,447
Moldova: 6,894
Georgia: 5,835
World Average: 5,581
Azerbaijan: 5,342
Turkmenistan: 5,320
Belarus (the data for Belarus may be wrong but, it’s the websites’ fault): 5,220
Armenia: 2,760
Uzbekistan: 2,664
Tajikistan: 2,562
Kyrgyzstan: 2,543
Here is how they fare relative to world average:
Lithuania: +60.28%
Russia: +43.83%
Kazakhstan: +41.07%
Ukraine: +36.00%
Estonia: +33.93%
Latvia: +33.43%
Moldova: +23.53%
Georgia: +4.55%
Azerbaijan: -4.28%
Turkmenistan: -4.68%
Belarus: -6.47%
Armenia: -50.55%
Uzbekistan: -52.27%
Tajikistan: -54.10%
Kyrgyzstan: -54.49%
As can be seen, while the Soviet Union was theoretically one country, it had significant regional inequalities. The Baltic States, Ukraine and Russia as well as Kazakhstan are doing well (perhaps that also includes Belarus as other estimates put them at 8 thousand for 1990). Everybody else not so much.
GDP per capita PPP, using the IMF data for 2025:
Lithuania: 57,196
Estonia: 49,671
Russia: 49,383
Latvia: 44,563
Kazakhstan: 44,446
Belarus: 34,313
Georgia: 30,749
Turkmenistan: 27,873
Azerbaijan: 26,235
World Average: 25,591
Armenia: 25,060
Ukraine: 20,999
Moldova: 19,678
Uzbekistan: 12,462
Kyrgyzstan: 8,781
Tajikistan: 6,048
Relative to world average:
Lithuania: +123.50%
Estonia: +94.10%
Russia: +92.97%
Latvia: +74.13%
Kazakhstan: +73.67%
Belarus: +34.08%
Georgia: +20.15%
Turkmenistan: +8.92%
Azerbaijan: +2.52%
Armenia: -2.07%
Ukraine: -17.94%
Moldova: -23.10%
Uzbekistan: -51.30%
Kyrgyzstan: -65.69%
Tajikistan: -76.37%
As can be clearly seen, the Baltic states, Russia, and Kazakhstan have greatly increased their standing relative to the rest of the world—suggesting, on economic grounds alone, that the collapse of the Soviet Union significantly enhanced their position compared to the global average. By contrast, Ukraine and Moldova have fallen behind, despite beginning above the world average.
Uzbekistan, Kyrgyzstan and Tajikistan who were a deadweight in the Soviet Era have deteriorated their standing even further.
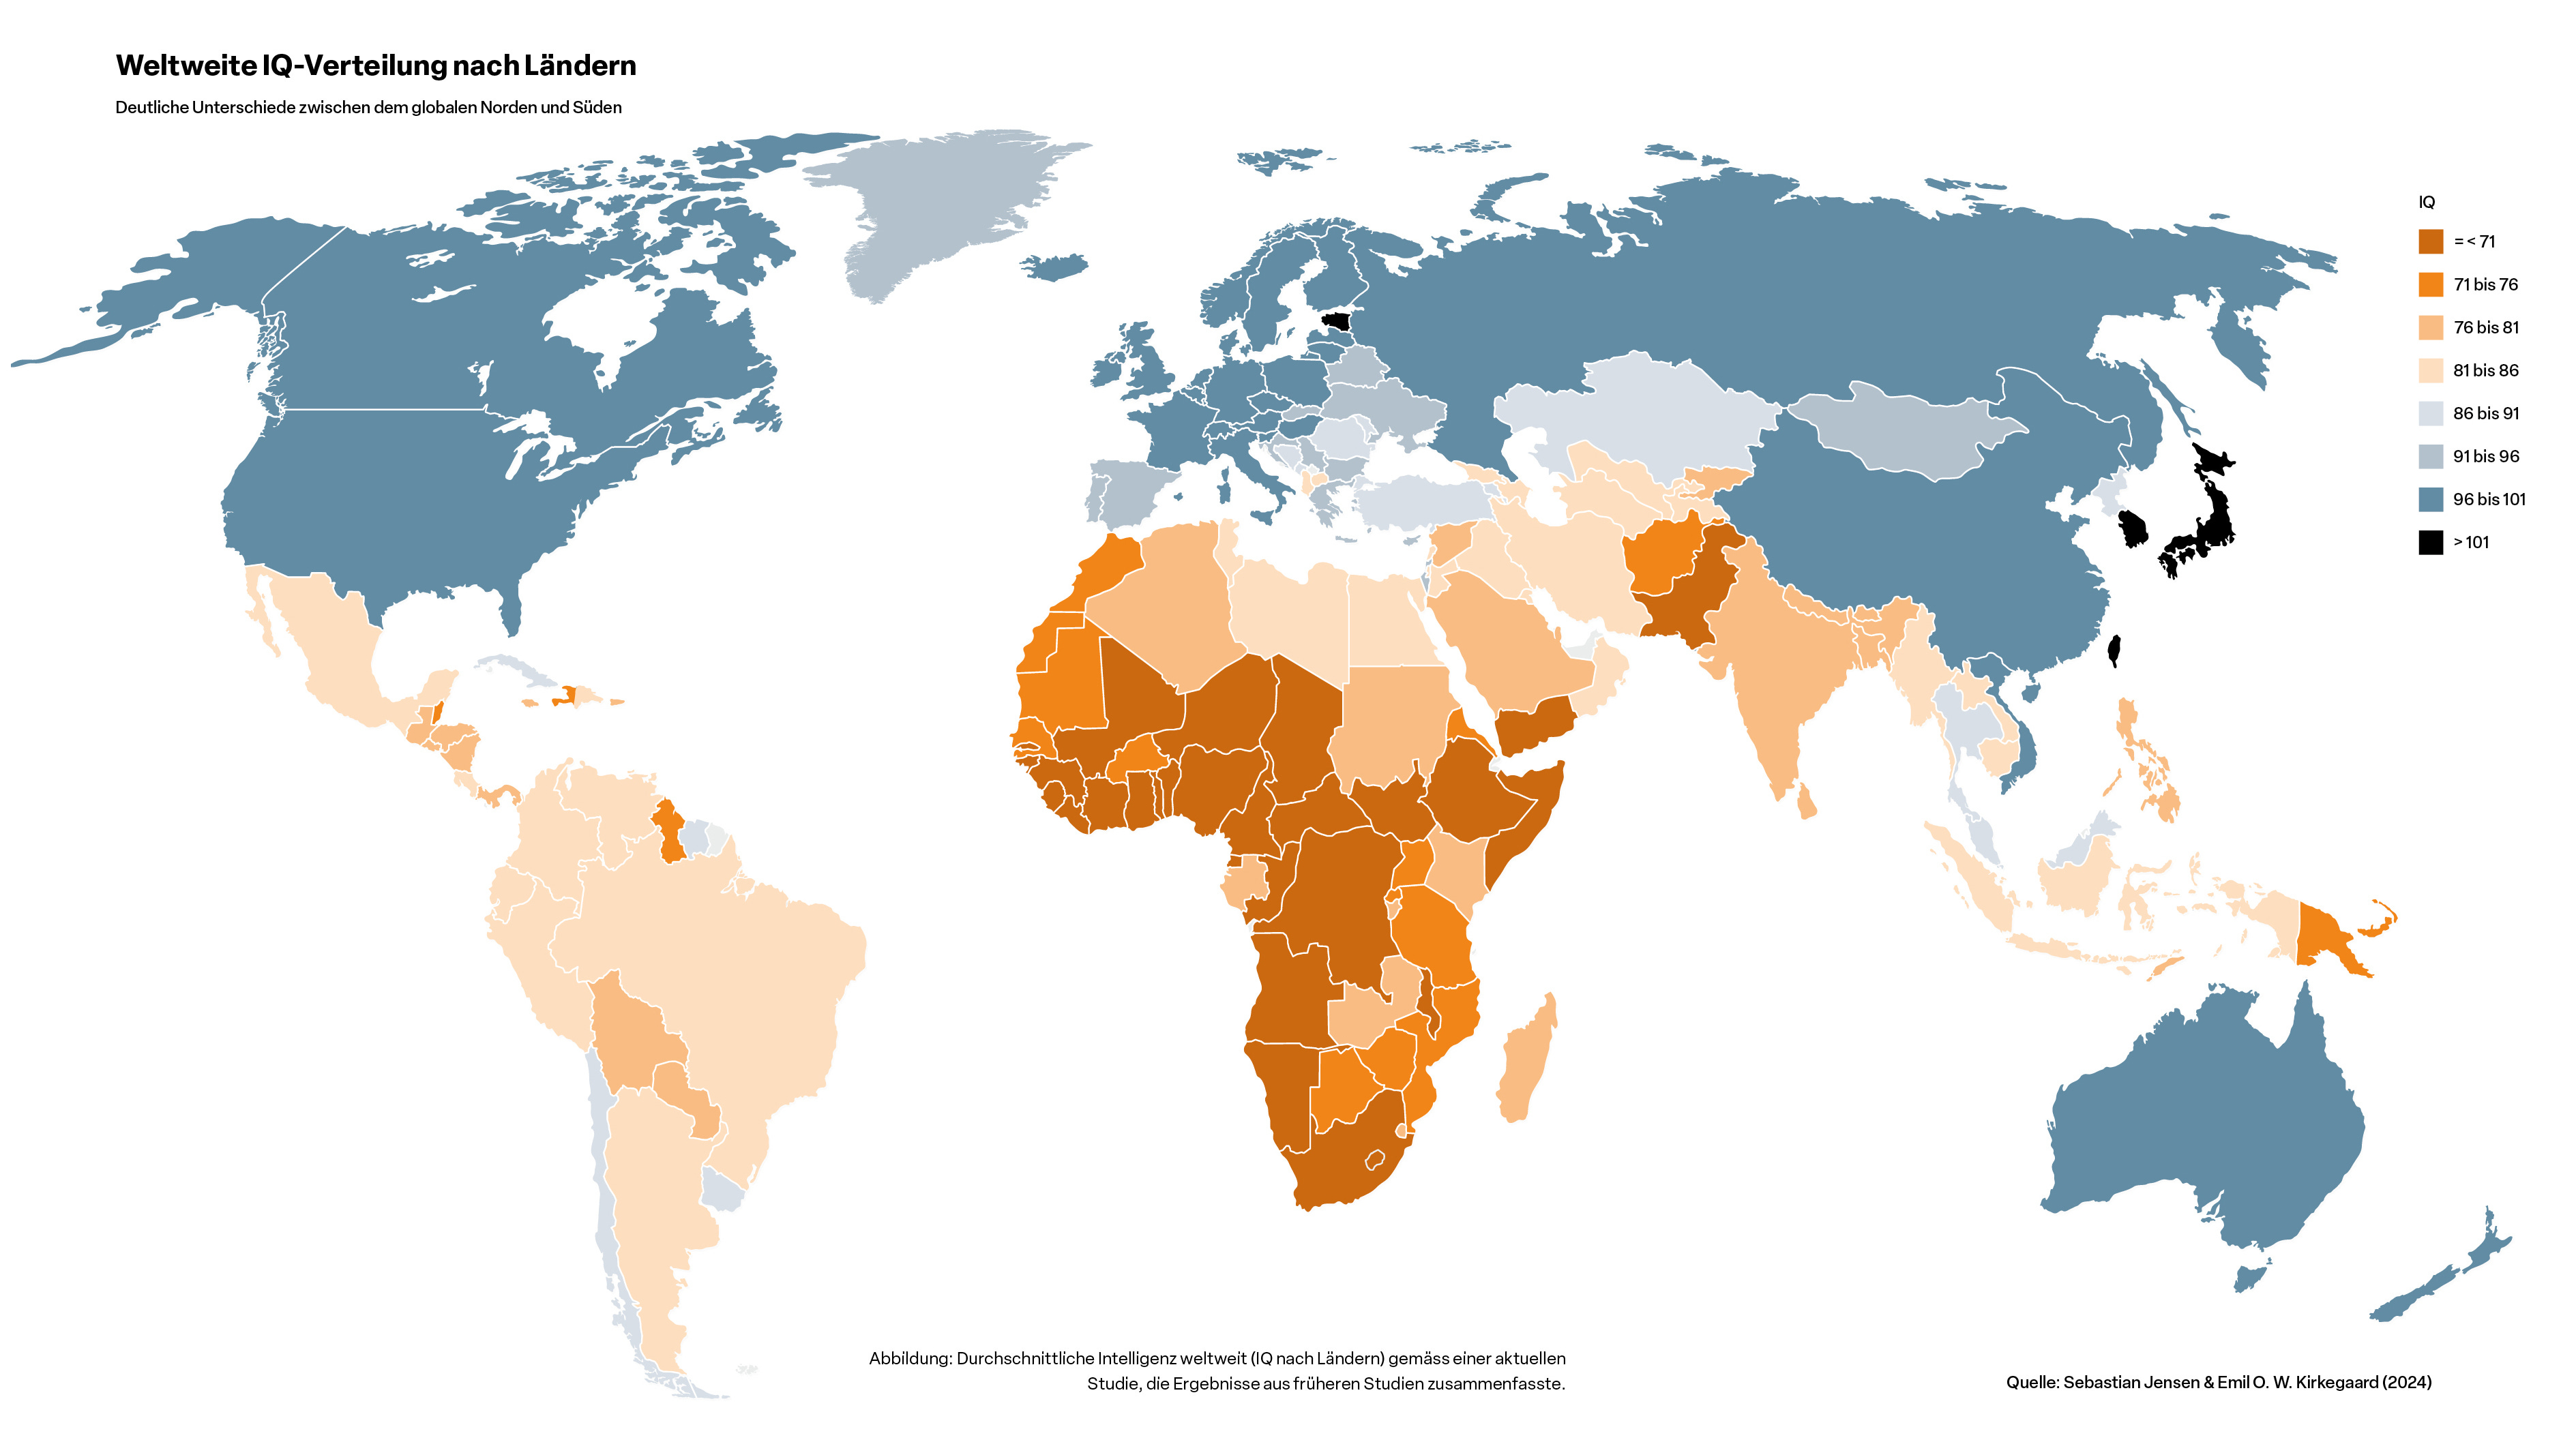
If we take a look at the IQ of the countries who have fallen behind, one may come to the conclusion that they are not capable in running their own country properly.
Finally I have measured a change in country’s GDP (PPP), relative to the world from as measured in 1990 and in 2025:
Lithuania: +63.22%
Estonia: +60.17%
Russia: +49.14%
Armenia: +48.48%
Latvia: +40.70%
Belarus: +40.55%
Kazakhstan: +32.60%
Georgia: +15.60%
Turkmenistan: +13.60%
Azerbaijan: +6.80%
Uzbekistan: +0.97%
Kyrgyzstan: -11.20%
Tajikistan: -22.27%
Moldova: -46.63%
Ukraine: -53.94%
Here is how I did it: (Change in Percentage Relative to the World’s Average = 2025 Percentage − 1990 Percentage).
If I were to discuss the impact of the Soviet Union’s collapse based on economics alone, I would point to the table above.
The next data point is less accurate than GDP PPP, but it is general enough to make broad judgements.
Human Development Index for 1990 (data for Belarus and a few other countries is approximated)
Russia: 0.741
Estonia: 0.741
Lithuania: 0.740
Latvia: 0.732
Ukraine: 0.731
Belarus: 0.69
Moldova: 0.688
Georgia: 0.68
Kazakhstan: 0.672
Armenia: 0.658
Kyrgyzstan: 0.637
Azerbaijan: 0.63
Turkmenistan: 0.62
Tajikistan: 0.616
Uzbekistan: 0.61
World Average: 0.6
Here is how they stand relative to world average:
Russia: +23.50%
Estonia: +23.50%
Lithuania: +23.33%
Latvia: +22.00%
Ukraine: +21.83%
Belarus: +15.00%
Moldova: +14.67%
Georgia: +13.33%
Kazakhstan: +12.00%
Armenia: +9.67%
Kyrgyzstan: +6.17%
Azerbaijan: +5.00%
Turkmenistan: +3.33%
Tajikistan: +2.67%
Uzbekistan: +1.67%
Now let’s take a look at Human Development Index from 2023
Estonia: 0.905
Lithuania: 0.895
Latvia: 0.889
Georgia: 0.844
Kazakhstan: 0.837
Russia: 0.832
Belarus: 0.824
Armenia: 0.811
Azerbaijan: 0.789
Moldova: 0.785
Ukraine: 0.779
Turkmenistan: 0.764
World Average: 0.744
Uzbekistan: 0.74
Kyrgyzstan: 0.72
Tajikistan: 0.691
Relative to world average:
Estonia: +21.64%
Lithuania: +20.30%
Latvia: +19.49%
Georgia: +13.44%
Kazakhstan: +12.50%
Russia: +11.83%
Belarus: +10.75%
Armenia: +9.01%
Azerbaijan: +6.05%
Moldova: +5.51%
Ukraine: +4.70%
Turkmenistan: +2.69%
Uzbekistan: -0.54%
Kyrgyzstan: -3.23%
Tajikistan: -7.12%
As you can see here we see the first clear breakaway for all Baltic states, pushing Russia into the same category as Georgia, Belarus and Kazakhstan even though Russia started as a country with the highest HDI for 1990. At the same time you can also see that HDI’s advantage relative to the rest of the world has now gotten smaller for all countries, including Estonia, which suggests that at least in this respect the entire world is moving ahead.
A change in country’s HDI, relative to the world’s average as measured in 1990 and in 2023:
Azerbaijan: +1.05%
Kazakhstan: +0.50%
Georgia: +0.11%
Turkmenistan: -0.64%
Armenia: -0.66%
Estonia: -1.86%
Uzbekistan: -2.21%
Latvia: -2.51%
Lithuania: -3.03%
Belarus: -4.25%
Moldova: -9.16%
Kyrgyzstan: -9.40%
Tajikistan: -9.79%
Russia: -11.67%
Ukraine: -17.13%
The only three countries who have somewhat improved their standing relative to the rest of the world are Azerbaijan, Kazakhstan and Georgia.
That being said, if we take a look at Percentage Change in HDI from 1990 to 2023 (country relative to itself), we can clearly see that the United States’ growth is similar to the growth of Ukraine, largely because the United States was already very developed in 1990. That is to say HDI is a good metric for poor and developing countries first and foremost.
Azerbaijan: +25.24%
Kazakhstan: +24.55%
Georgia: +24.12%
World Average: +24.00%
Armenia: +23.25%
Turkmenistan: +23.23%
Estonia: +22.13%
Uzbekistan: +21.31%
Latvia: +21.45%
Lithuania: +20.95%
Belarus: +19.42%
Moldova: +14.10%
Kyrgyzstan: +13.03%
Russia: +12.28%
Tajikistan: +12.18%
United States (for reference): +7.2%
Ukraine: +6.57%
Finally, let’s take a look at population numbers. Which post-Soviet countries gained in population and which didn’t.
Soviet Union’s Republics 1989 census:
Russian SFSR: 147,400,537
Ukraine: 51,706,742
Uzbekistan: 19,905,158
Kazakhstan: 16,536,511
Byelorussia: 10,199,709
Azerbaijan: 7,037,867
Georgia: 5,443,359
Tajikistan: 5,108,576
Moldavia: 4,337,592
Kirghizia: 4,290,442
Lithuania: 3,689,779
Turkmenia: 3,533,925
Armenia: 3,287,677
Latvia: 2,680,029
Estonia: 1,572,916
Population of Post Soviet Countries in 2025 (Crimea, Russian controlled Donbass and South Ukraine were counted as Russian):
Russia: 149,997,393
Uzbekistan: 37,053,428
Ukraine: 32,980,376
Kazakhstan: 20,843,754
Belarus: 8,997,603
Azerbaijan: 10,397,713
Georgia: 3,806,671
Tajikistan: 10,786,734
Moldova: 2,996,106
Kyrgyzstan: 7,295,034
Lithuania: 2,830,144
Turkmenistan: 7,618,847
Armenia: 2,952,365
Latvia: 1,853,559
Estonia: 1,344,232
Percentage change in population between 1989 and 2025 (Highest to Lowest Population Gain):
1. Turkmenistan: +115.59%
2. Tajikistan: +111.15%
3. Uzbekistan: +86.15%
4. Kyrgyzstan: +70.02%
5. Azerbaijan: +47.74%
6. Kazakhstan: +26.04%
7. Russia: +1.76%
8. Armenia: -10.20%
9. Belarus: -11.79%
10. Estonia: -14.54%
11. Lithuania: -23.30%
12. Georgia: -30.07%
13. Latvia: -30.84%
14. Moldova: -30.92%
15. Ukraine: -36.22%
As you can clearly see, all Central Asian countries and Azerbaijan had a large growth which was driven by their high fertility rate. Russia had balanced around 0% growth while every other European country had experienced a massive shrinkage with Georgia, Latvia, Moldova and Ukraine losing about a third of their population in 35 years of independence.
Paid version has the remaining half of the content. It includes all countries in Eastern Europe as well as data on fertility rates and how significantly they fell. If you are curious to see how did Serbians or Poles fare after the collapse of the Soviet Union, get a paid subscription!
